Iterative Proportional Fitting
More pages in this category:
# Introduction
Iterative proportional fitting (IPF) serves to create two-dimensional tables (such as households by income and household size) from separate one-dimensional input data (such as one list of households by income and another list of households by size). IPF may also be called matrix balancing or the RAS method in other fields.
# Problem setup
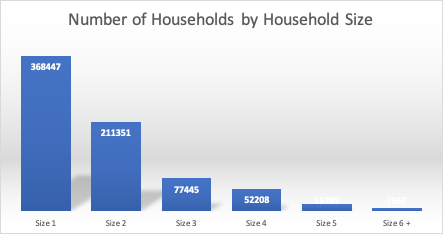
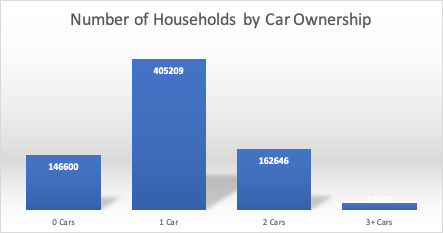
Imagine you have separate data on total households by household size and number of households by car-ownership.

Example: Households by Size

Example: Households by Car-Ownership
IPF can be used to create a matrix of households across both of these dimensions, while respecting the given totals. In other words, the goal of IPF is to fill the cells in this matrix, while respecting row and column totals:

Example: Households by Size and Car-Ownership
# Solution
The table is filled with starting values and adjusted iteratively to match row totals and column totals.
First, values for each cell in this matrix need to be set to some initial value. This starting values could be set at 1 if no better information is available, or the values could be based on those from another location or past study.
# Iteration 1
The example below initializes the table with values of 1. Next, the row sum is calculated. (The process could equally well start with column sums). Obviously, the row sum is far off from row target since we assumed a naive value of 1 to start. The ratio between the row and column sums describes the correction that is needed to reach the row totals.

After multiplying every cell in the matrix with the corresponding row ratio, the table has these values:

The sum of every row perfectly matches the row totals, but the column totals are far off.
# Iteration 2
Since the column totals are so far off, we see that the number of households by household size from the matrix does not match the known (1-dimensional) totals. By summing up values across columns, the ratios between target column totals and actual column totals are calculated.

Next, every cell is multiplied with the column-specific ratio, which corrects values to perfectly match target column totals.

In this simple example, both row and column targets are met after two iterations.
# Refinements
If better starting values than 1's can be obtained, the resulting matrix will be more reasonable. Additional iterations will be required to match both column and row totals, but results will be more realistic.
It is also possible to set selected cells to 0. For example, if there was evidence that there were no 1-person households with 3 or more cars, the lower right cell could be set to 0. As adjustments are made by multiplication, the resulting table will have no households with size 1 and 3+ cars, while column and row totals are still matched:

# Multi-dimensional IPF
IPF can be conducted by multiple (more than two) dimensions. For example, there might be interest to create a three-dimensional matrix of households by
- size
- number of cars
- income group
Each iteration will adjust the matrix three times to match the control totals in these three dimensions.
