Accessibility
# Introduction
Accessibility is the ability for individuals to reach destinations where they can accomplish their daily activities. It is an underlying assumption of travel behavior and travel modeling that an increased ability to make trips brings value to people and therefore maximizing accessibility for the most people is often a goal of the transportation planning process. Planners therefore have two general paths to increasing accessibility in a given zone:
- Reduce travel time between the zone and destination zones with many activity centers
- Increase the number of activity centers close to the zone.
Accessibility is an abstract concept without a formal mathematical definition. That said, numerous researchers and practitioners have developed a wide array of techniques to measure and compare the accessibility of various locations and under various scenarios (see Handy and Niemeier, 1997 (opens new window); Geurs and van Wee, 2004 (opens new window) ).
In general, quantitative accessibility measures describe how many destinations can be reached how easily from a particular zone.
This page discusses how accessibility has been or can be used in travel analysis, as well as common quantitative forms for representing accessibility.
# Relevance of Accessibility to Models
Accessibility can be used within travel demand models to influence the number of trips generated and the trip length, assuming that more accessible neighborhoods tend to generate more trips of a shorter average distance. In less accessible regions, travelers are assumed to combine travel to several destinations in tours. This in turn influences mode choice outcomes, as shorter trips might be more readily handled with active transportation or certain public transit services.
Land use models use accessibility as a primary consideration in household and firm location choice, as well as in floorspace development. It is assumed that households, firms, and developers prefer locations with higher accessibility as --- all else equal --- locations with higher accessibility increase access to labor, jobs, and reduce travel costs.
# Quantitative Forms
Three basic quantitative form for accessibility measures exist:
- Isochrone
- Gravity
- Utility-based
Each method has its advantages and disadvantages, which are summarized in the table below. A helpful overview of the various quantitative forms is given by Dong, et al. (2006) (opens new window). Details on the quantitative methods as well as justification of the advantages and disadvantages are given in the following sections.
| Method | Advantages | Disadvantages |
|---|---|---|
| Isochrone | Simple, easy to explain to policy makers | Arbitrary, single-mode definitions of distance |
| Gravity | Relatively simple, used in travel model | Single-mode definitions of distance |
| Utility-based | Strong theoretical basis, used directly within travel model | Complex, difficult to explain to policymakers |
# Isochrone
Generally speaking, an isochochrone is a region that can be reached within a
particular travel time. Isochrone-derived accessibility measures therefore often
take the form of "In this scenario,
Mathematically, an isochrone accessibility measure for a particular zone
is the accessibility in zone is the total number of opportunities at zone is the set of all destination zones if the distance between and is within certain threshold, and otherwise.
These measures can be very useful, particularly when considering improvements to a single mode. Increasing the transit service area or transit travel speeds will increase the number of jobs and other opportunities that can be reached within the specified isochone. This number can be easily understood by policy makers and can help to build a story around a proposed transportation alternative.
A critical weakness of isochrone measures is that they are by definition arbitrary. The time threshold may be set at 20, 30, 45, or 60 minutes depending on the particular application. They are also binary, in that a 31-minute trip would be excluded from a 30-minute isochrone even though the behavioral meaning of an additional one minute on a trip that long is largely negligible. The travel time must also be defined for a single mode. It is therefore challenging to use these measures when comparing multi-modal projects: public transit and active transportation projects will almost always suffer in comparison against highway projects when evaluating the projects using isochrone-derived accessibility measures.
# Gravity
In the common gravity-based trip distribution model, trips from an origin zone are allocated among potential destination zones by considering the distance-discounted size of each zone in terms of the number of activities happening there. This model can be used to generate an accessibility measure with the mathematical representation:
Where
is the accessibility in zone is the total number of opportunities at zone is the set of all destination zones is the travel time or generalized cost of travel between and . is an impedance function attenuating the role of travel time in the model
Gravity-based models have two major advantages relative to isochrone measures. First, travel costs are represented with a continuous function, thus allowing activities just outside of an arbitrary isochrone boundary to count as possible destinations. Second, the basic gravity model has shown remarkable flexibility in terms of the number and types of weights and functions that can be incorporated, including the specifications of Hansen (1959) (opens new window), Wilson (1967) (opens new window) and many others.
In spite of this flexibility (and their relatively wide use), gravity-based measures still have some weaknesses. As with isochrone-based measures, it is difficult to represent travel impedances across multiple modes in a rational and comparative framework. Beyond this, the gravity model in general is an abstraction of observed behavior, and is not itself rooted in any theoretical basis of how people choose destinations.
# Utility-based
In econometric choice theory often used in mode choice and destination choice models, the probability of choosing one alternative among several options is a ratio incorporating the various utility of each alternative. The logarithm of the denominator of this ratio --- called the log-sum --- can be used directly as an accessibility measure. Mathematically, this is represented as
is the accessibility in zone is the set of all destination zones is the utility of selecting destination .
The utility term
Where
describes the opportunities at zone is a vector of coefficients describing the relationship between opportunities and utility is an impedance function attenuating the role of travel costs in the model
The utility function can specify any elements for which an analyst can obtain data, lending utility-based accessibility terms an effectively limitless flexibility. Destination choice log-sums are also readily available within travel demand models that include destination choice models, making obtaining and using utility-based logsums relatively trivial. This measure is also deeply rooted in the same choice theory that forms the basis of travel models more generally.
# Example
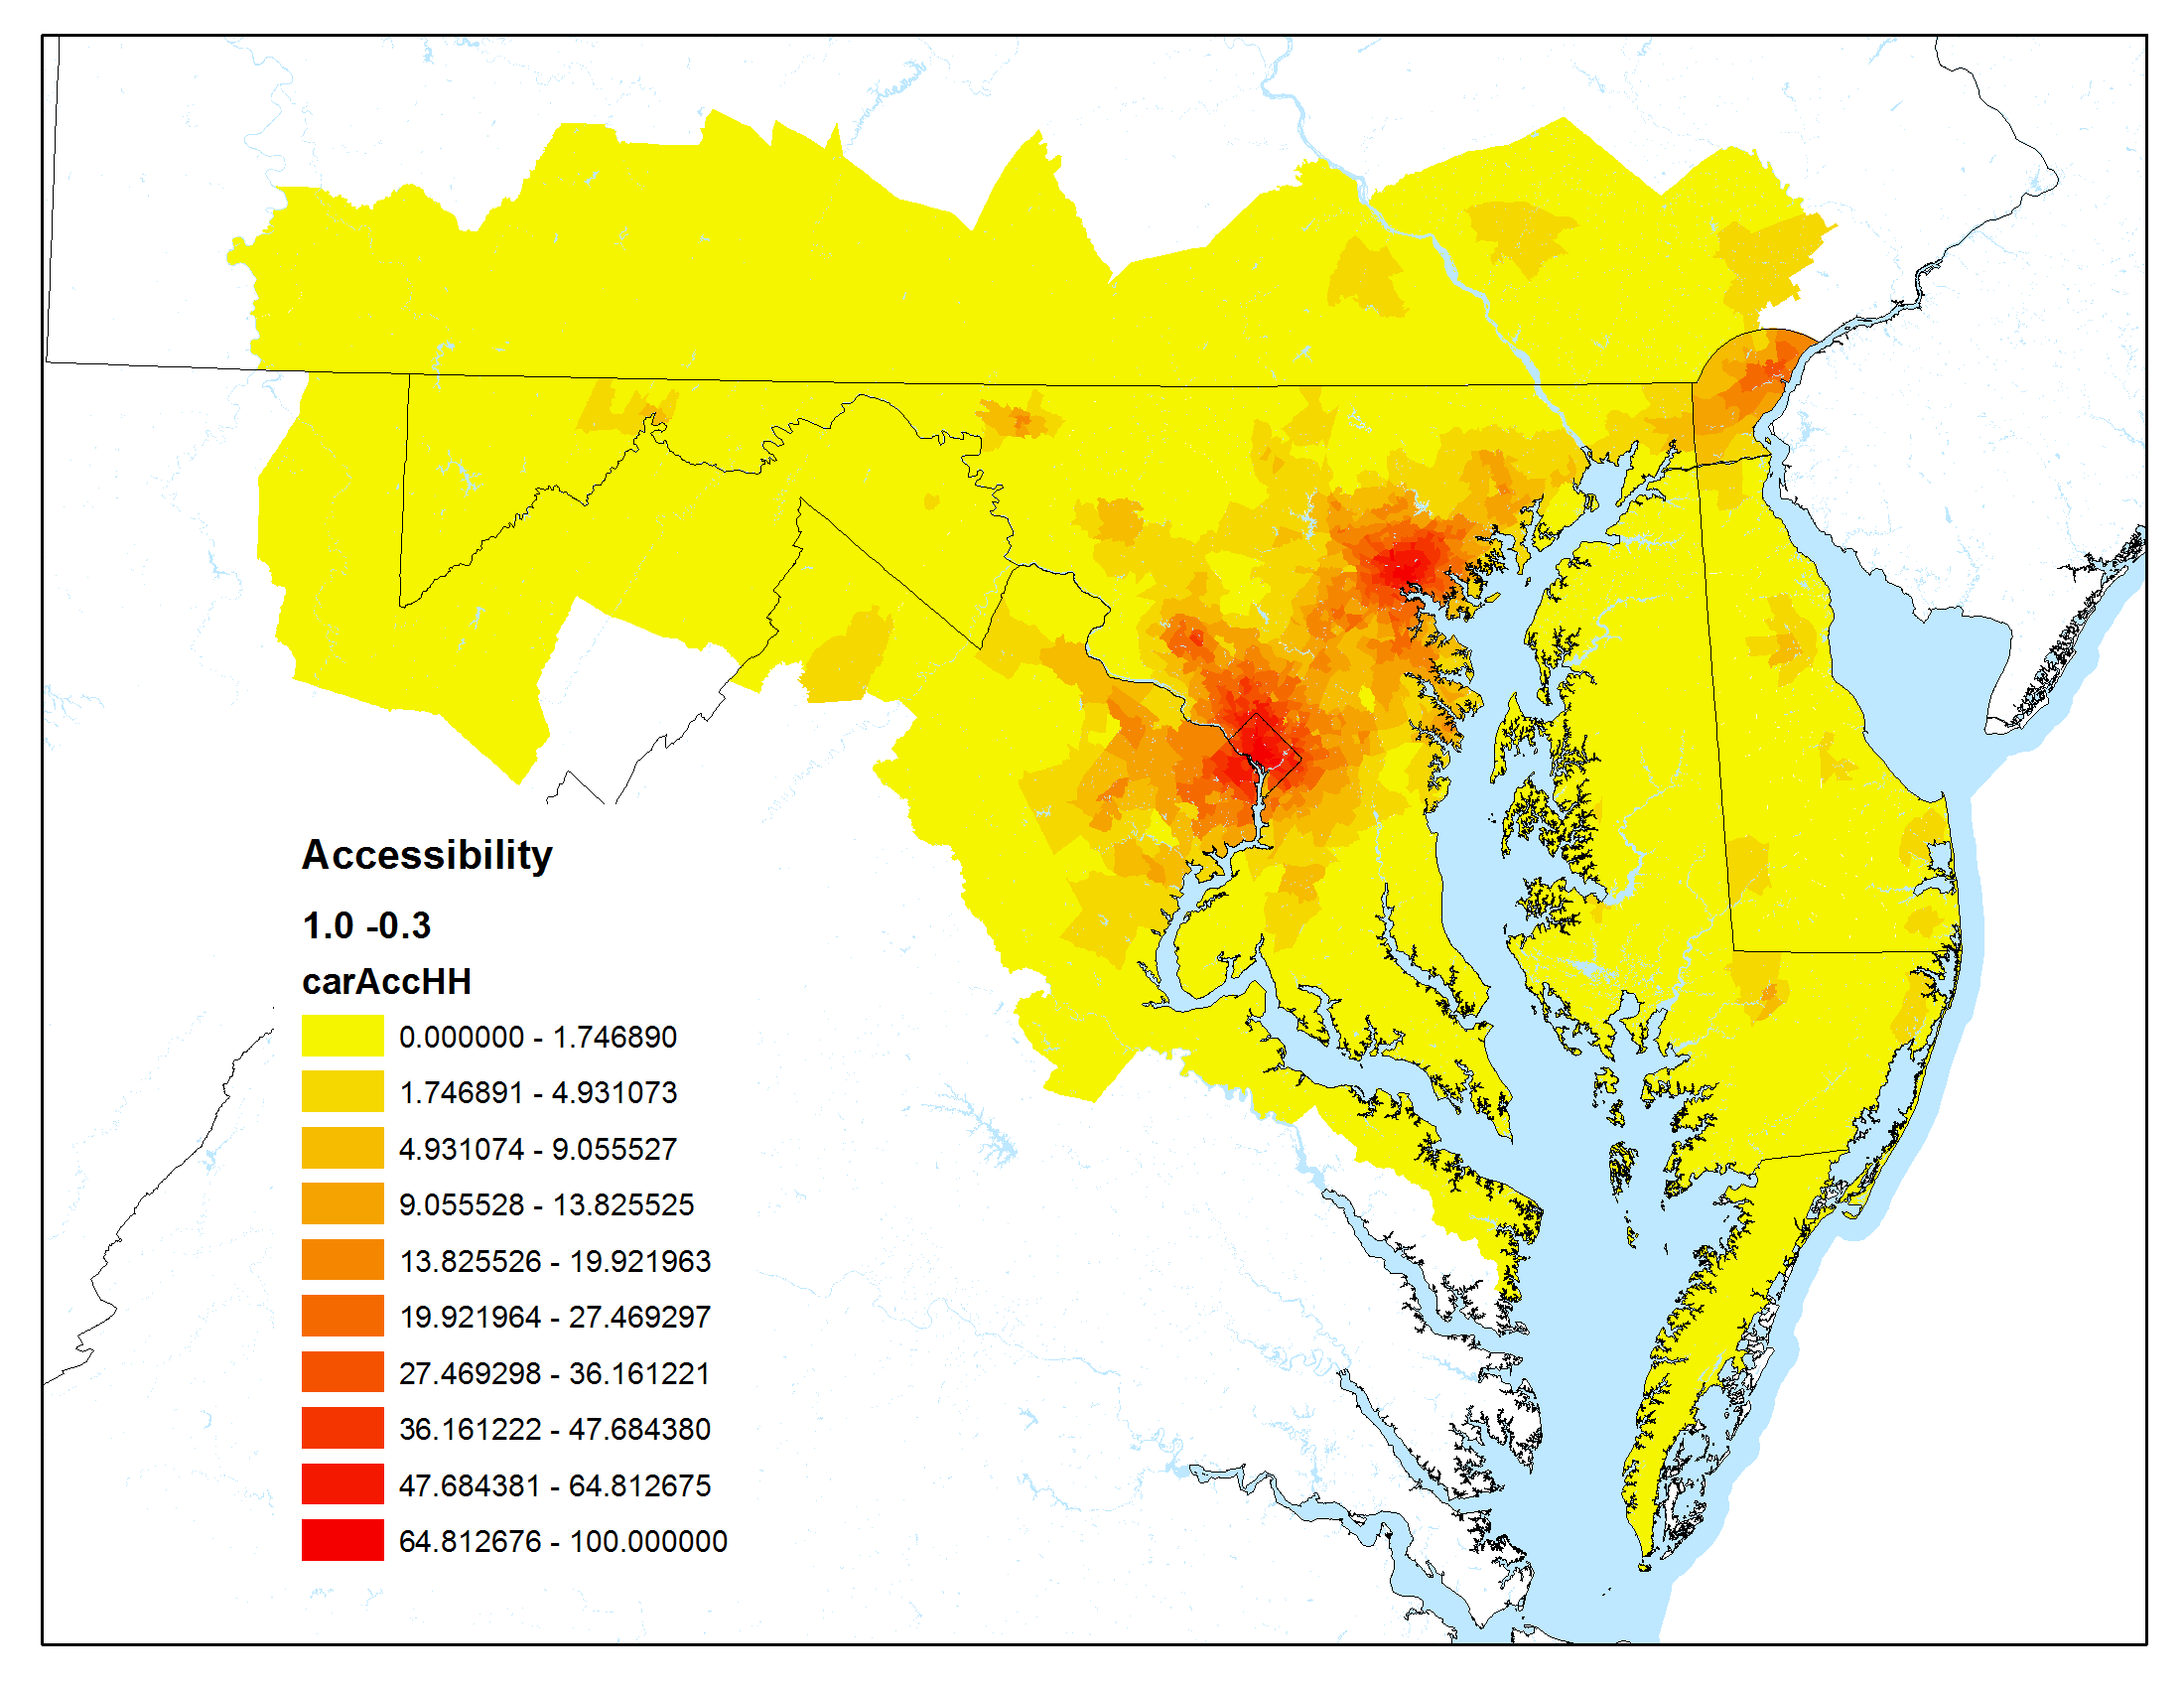
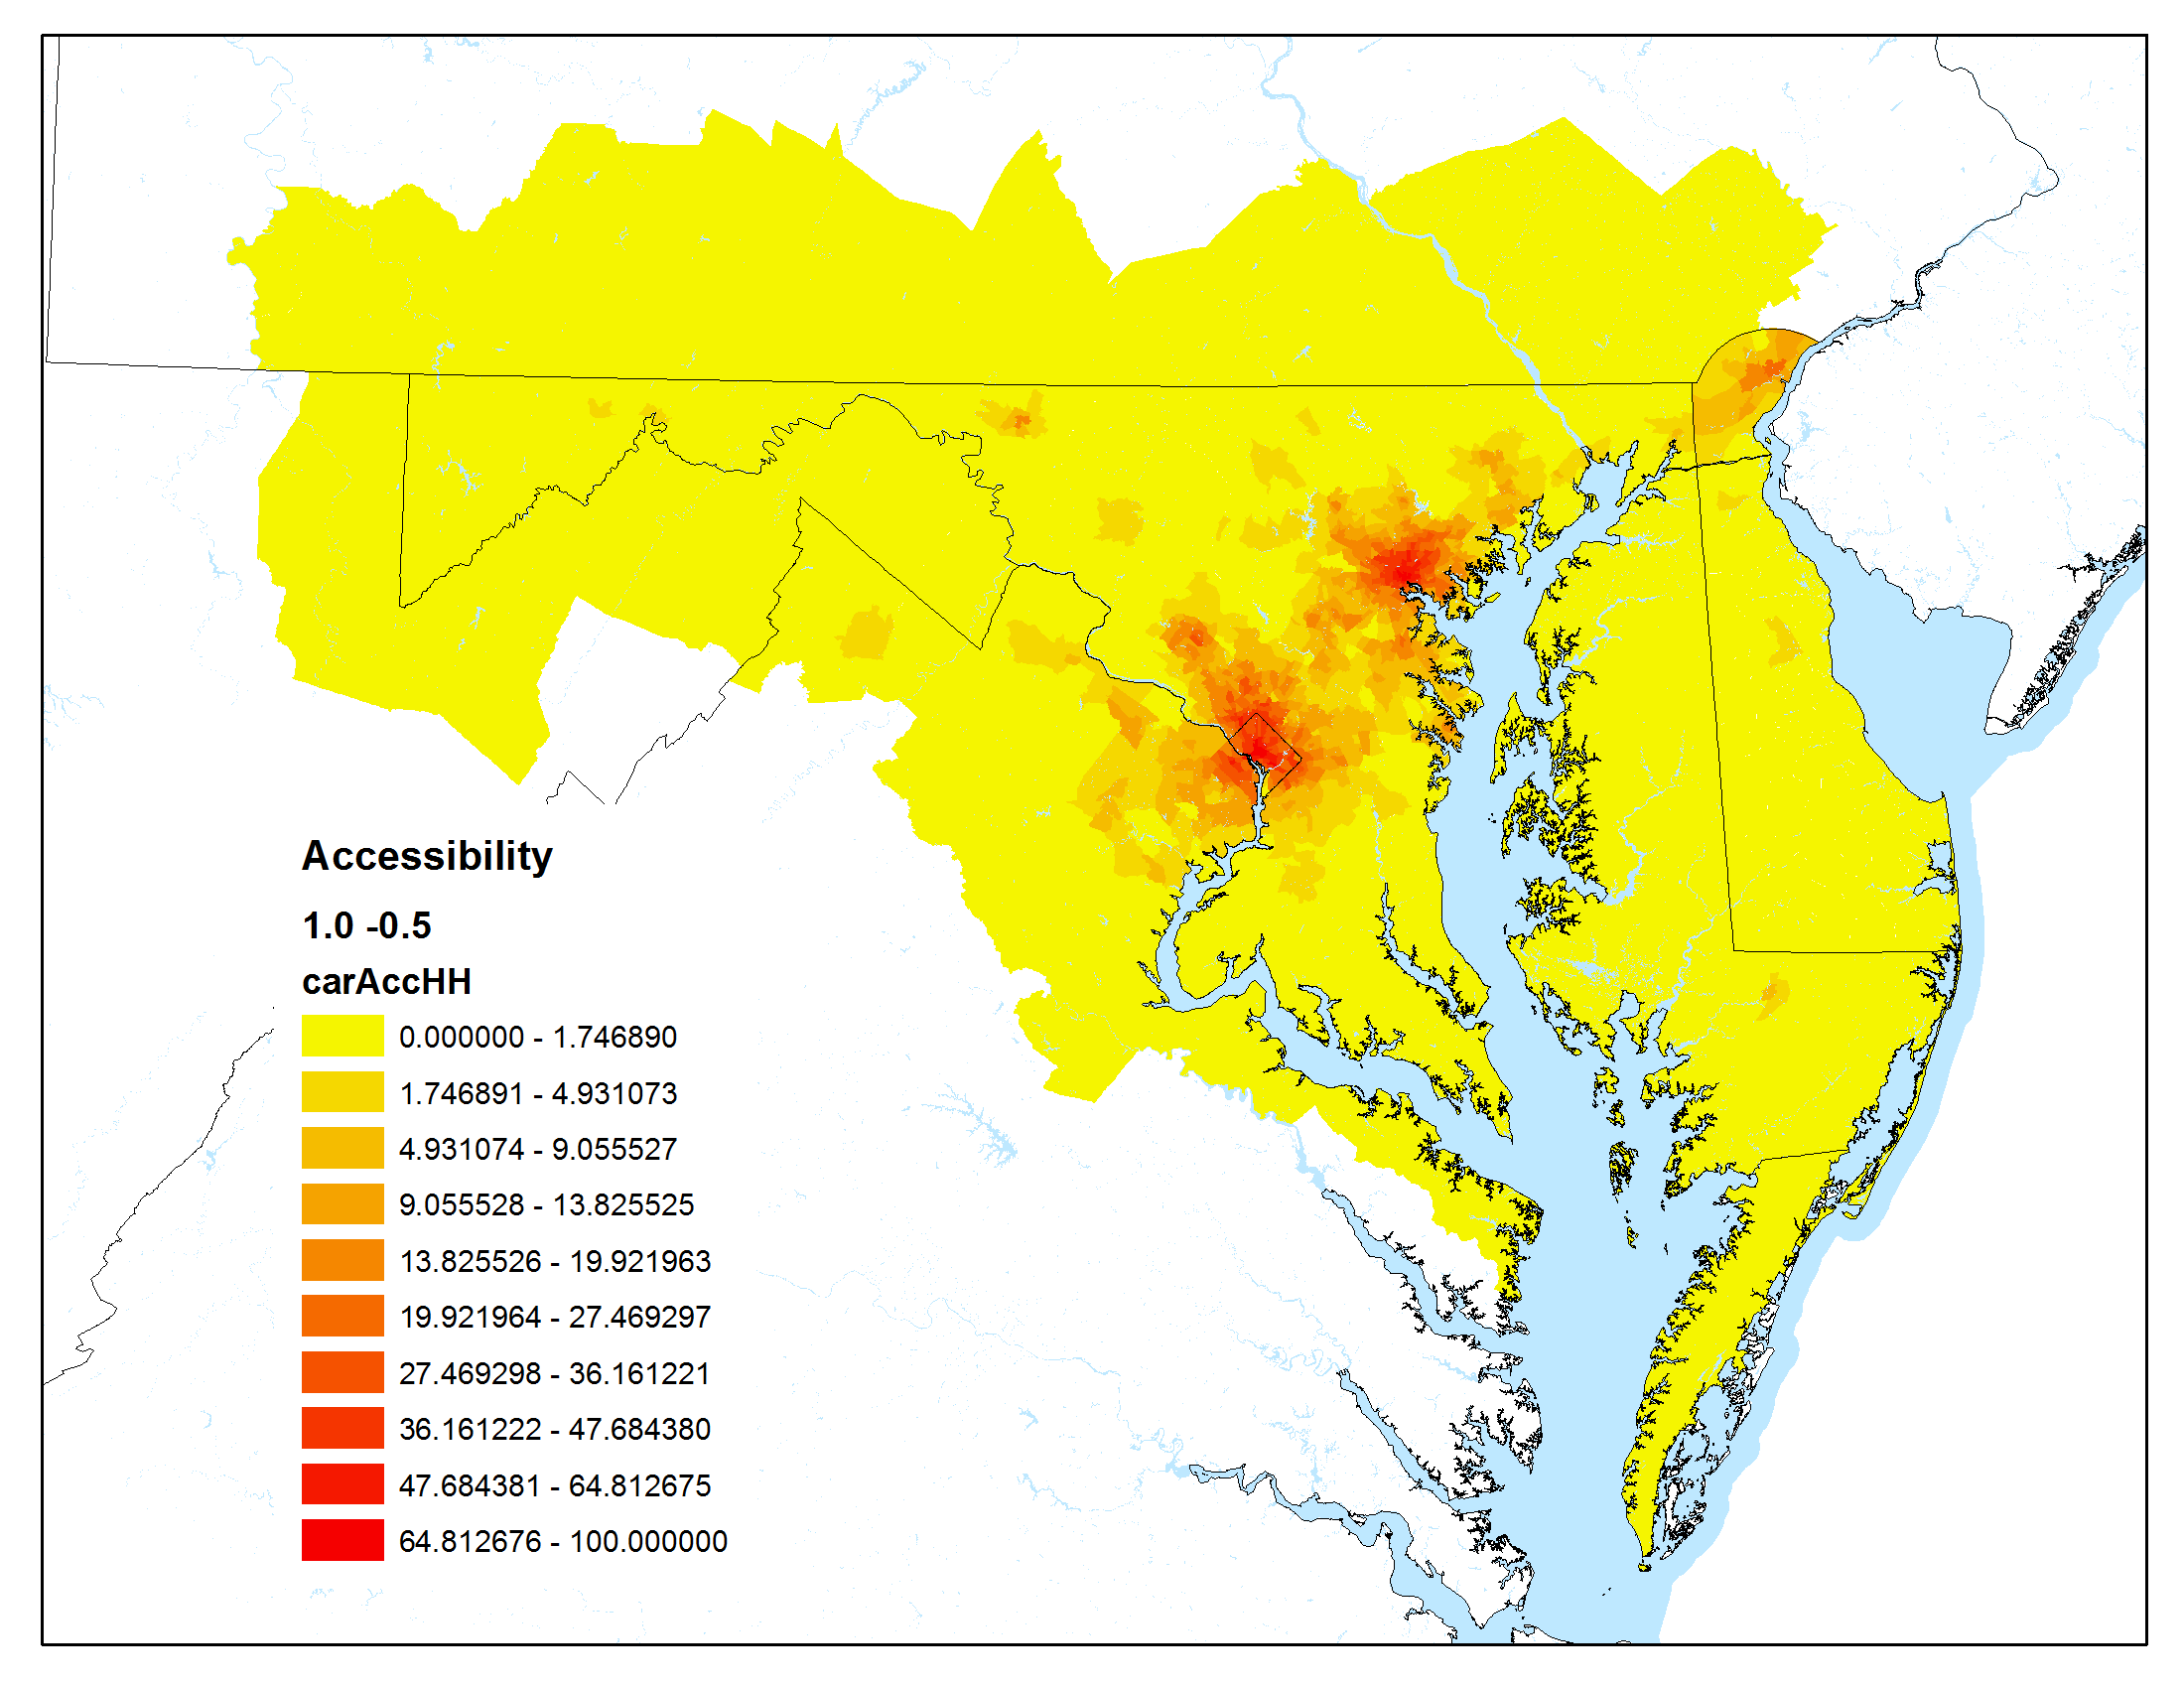
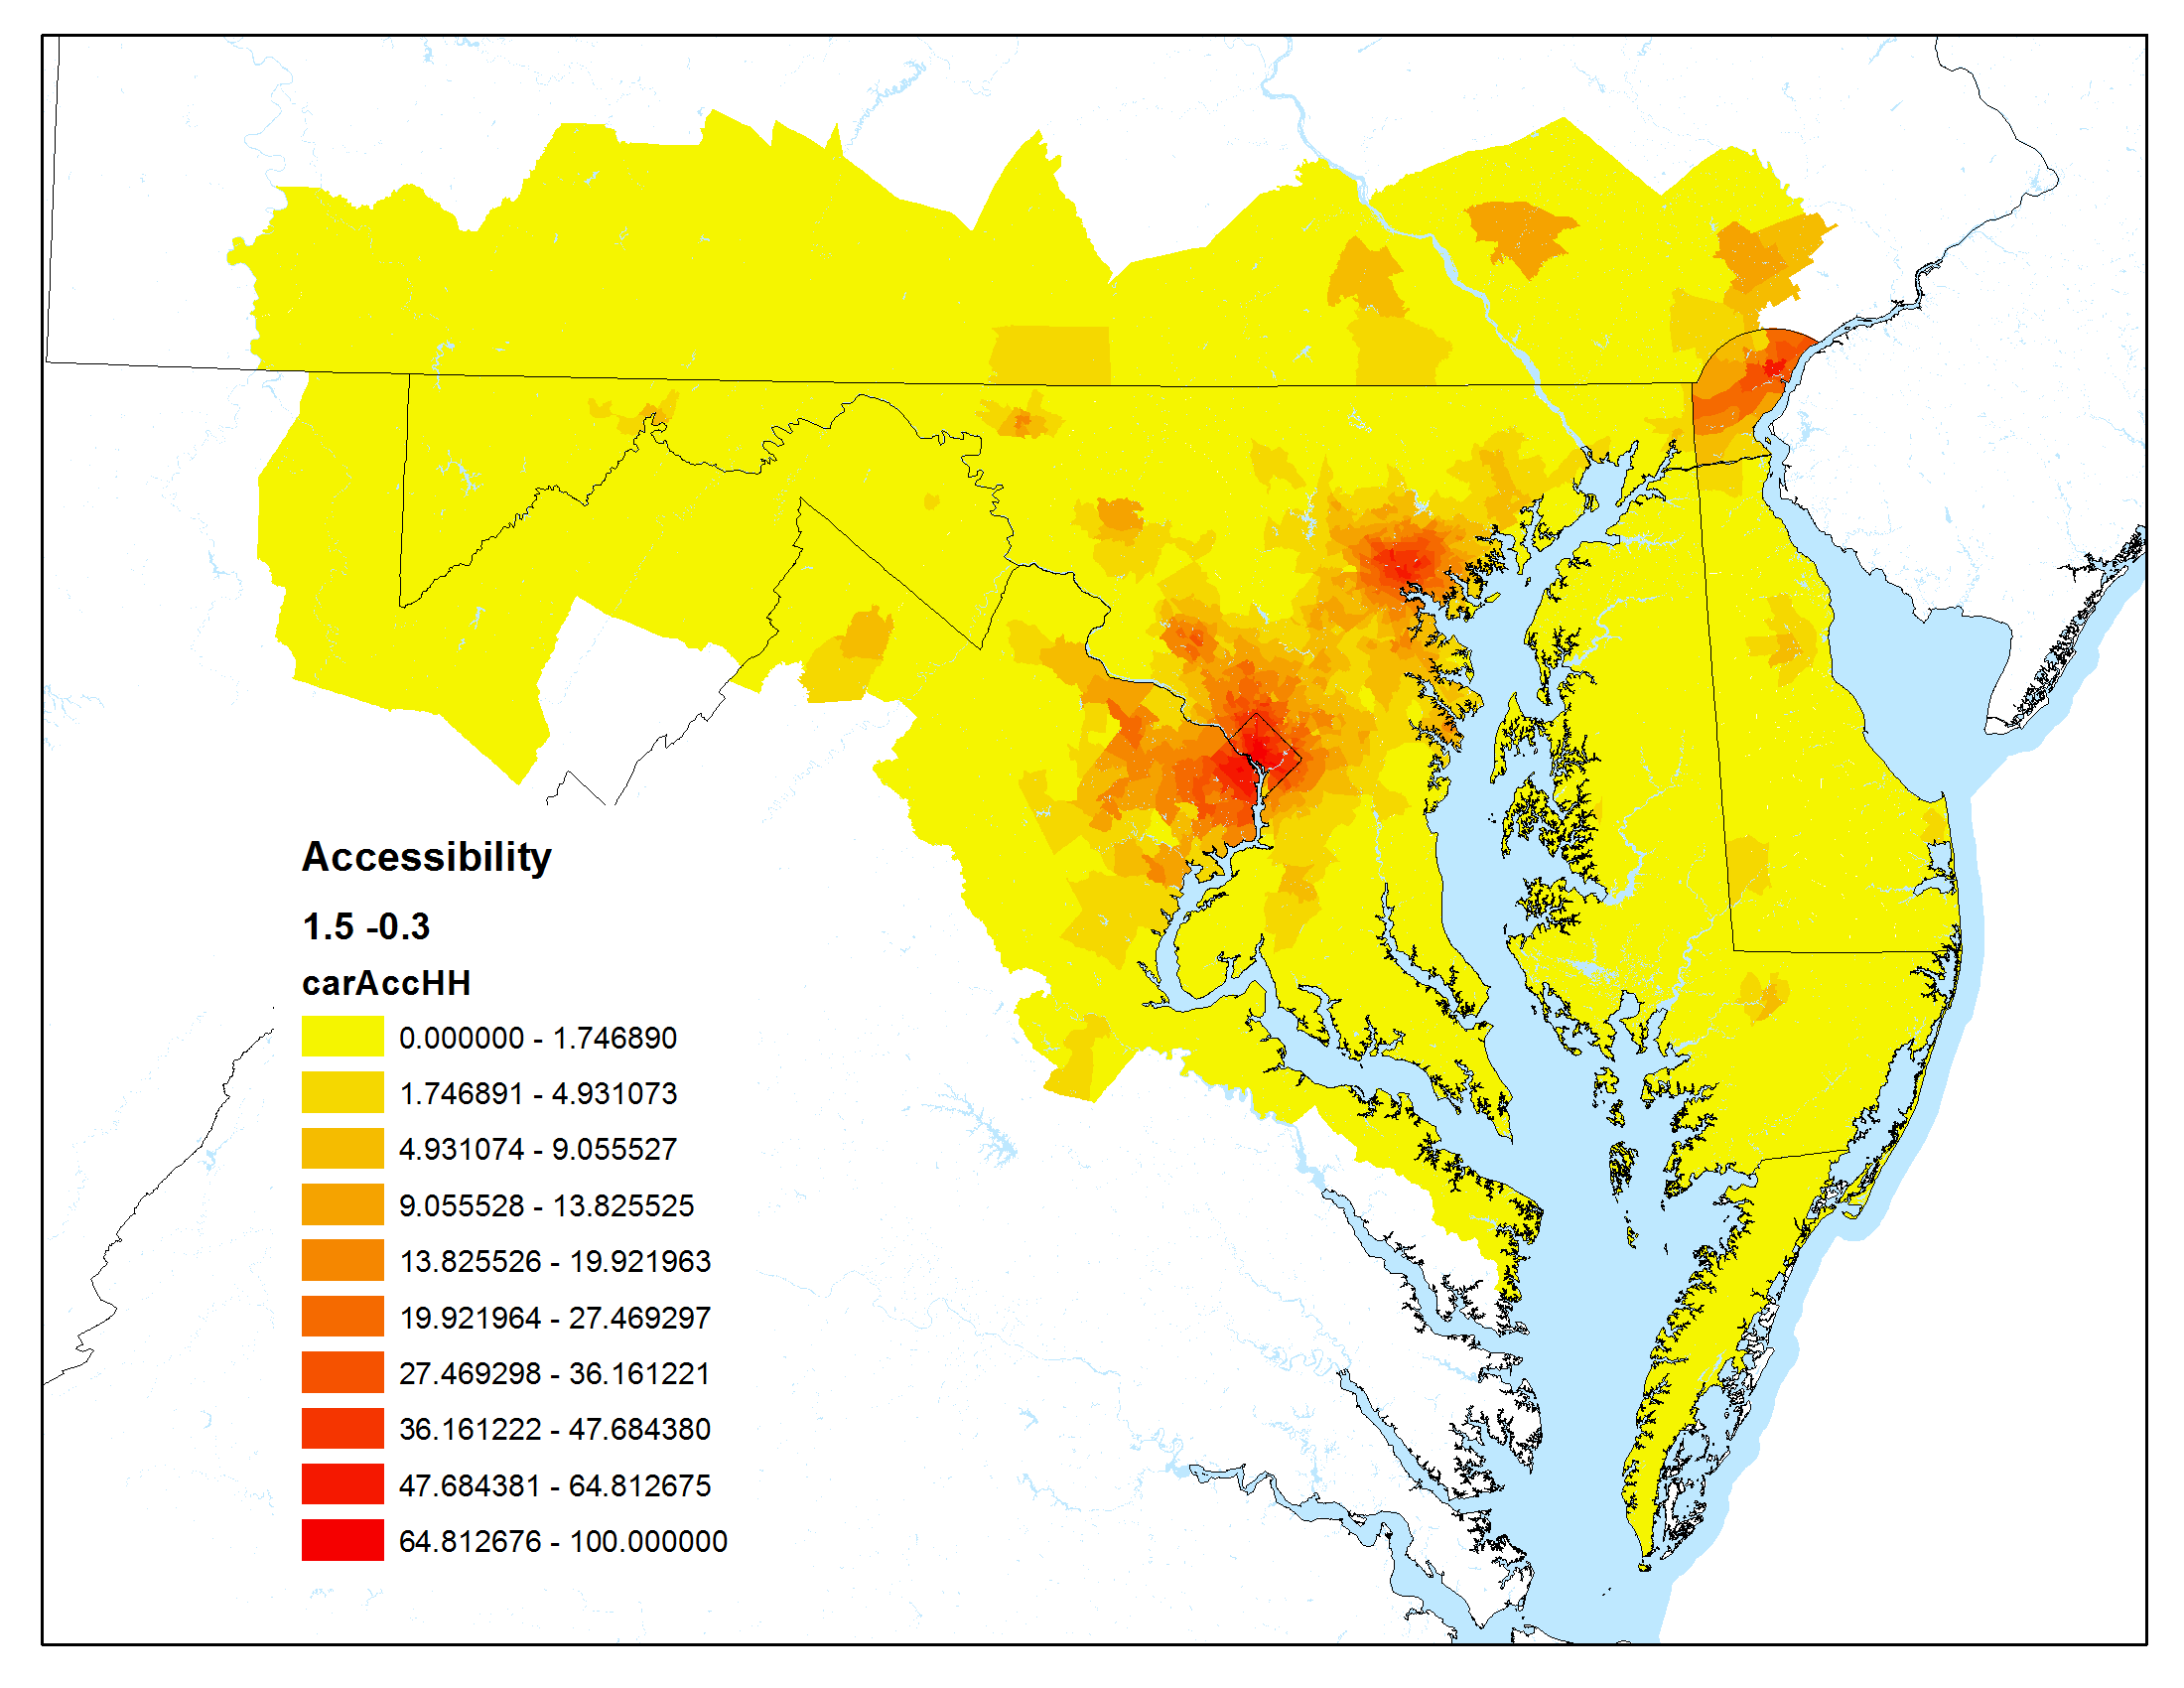
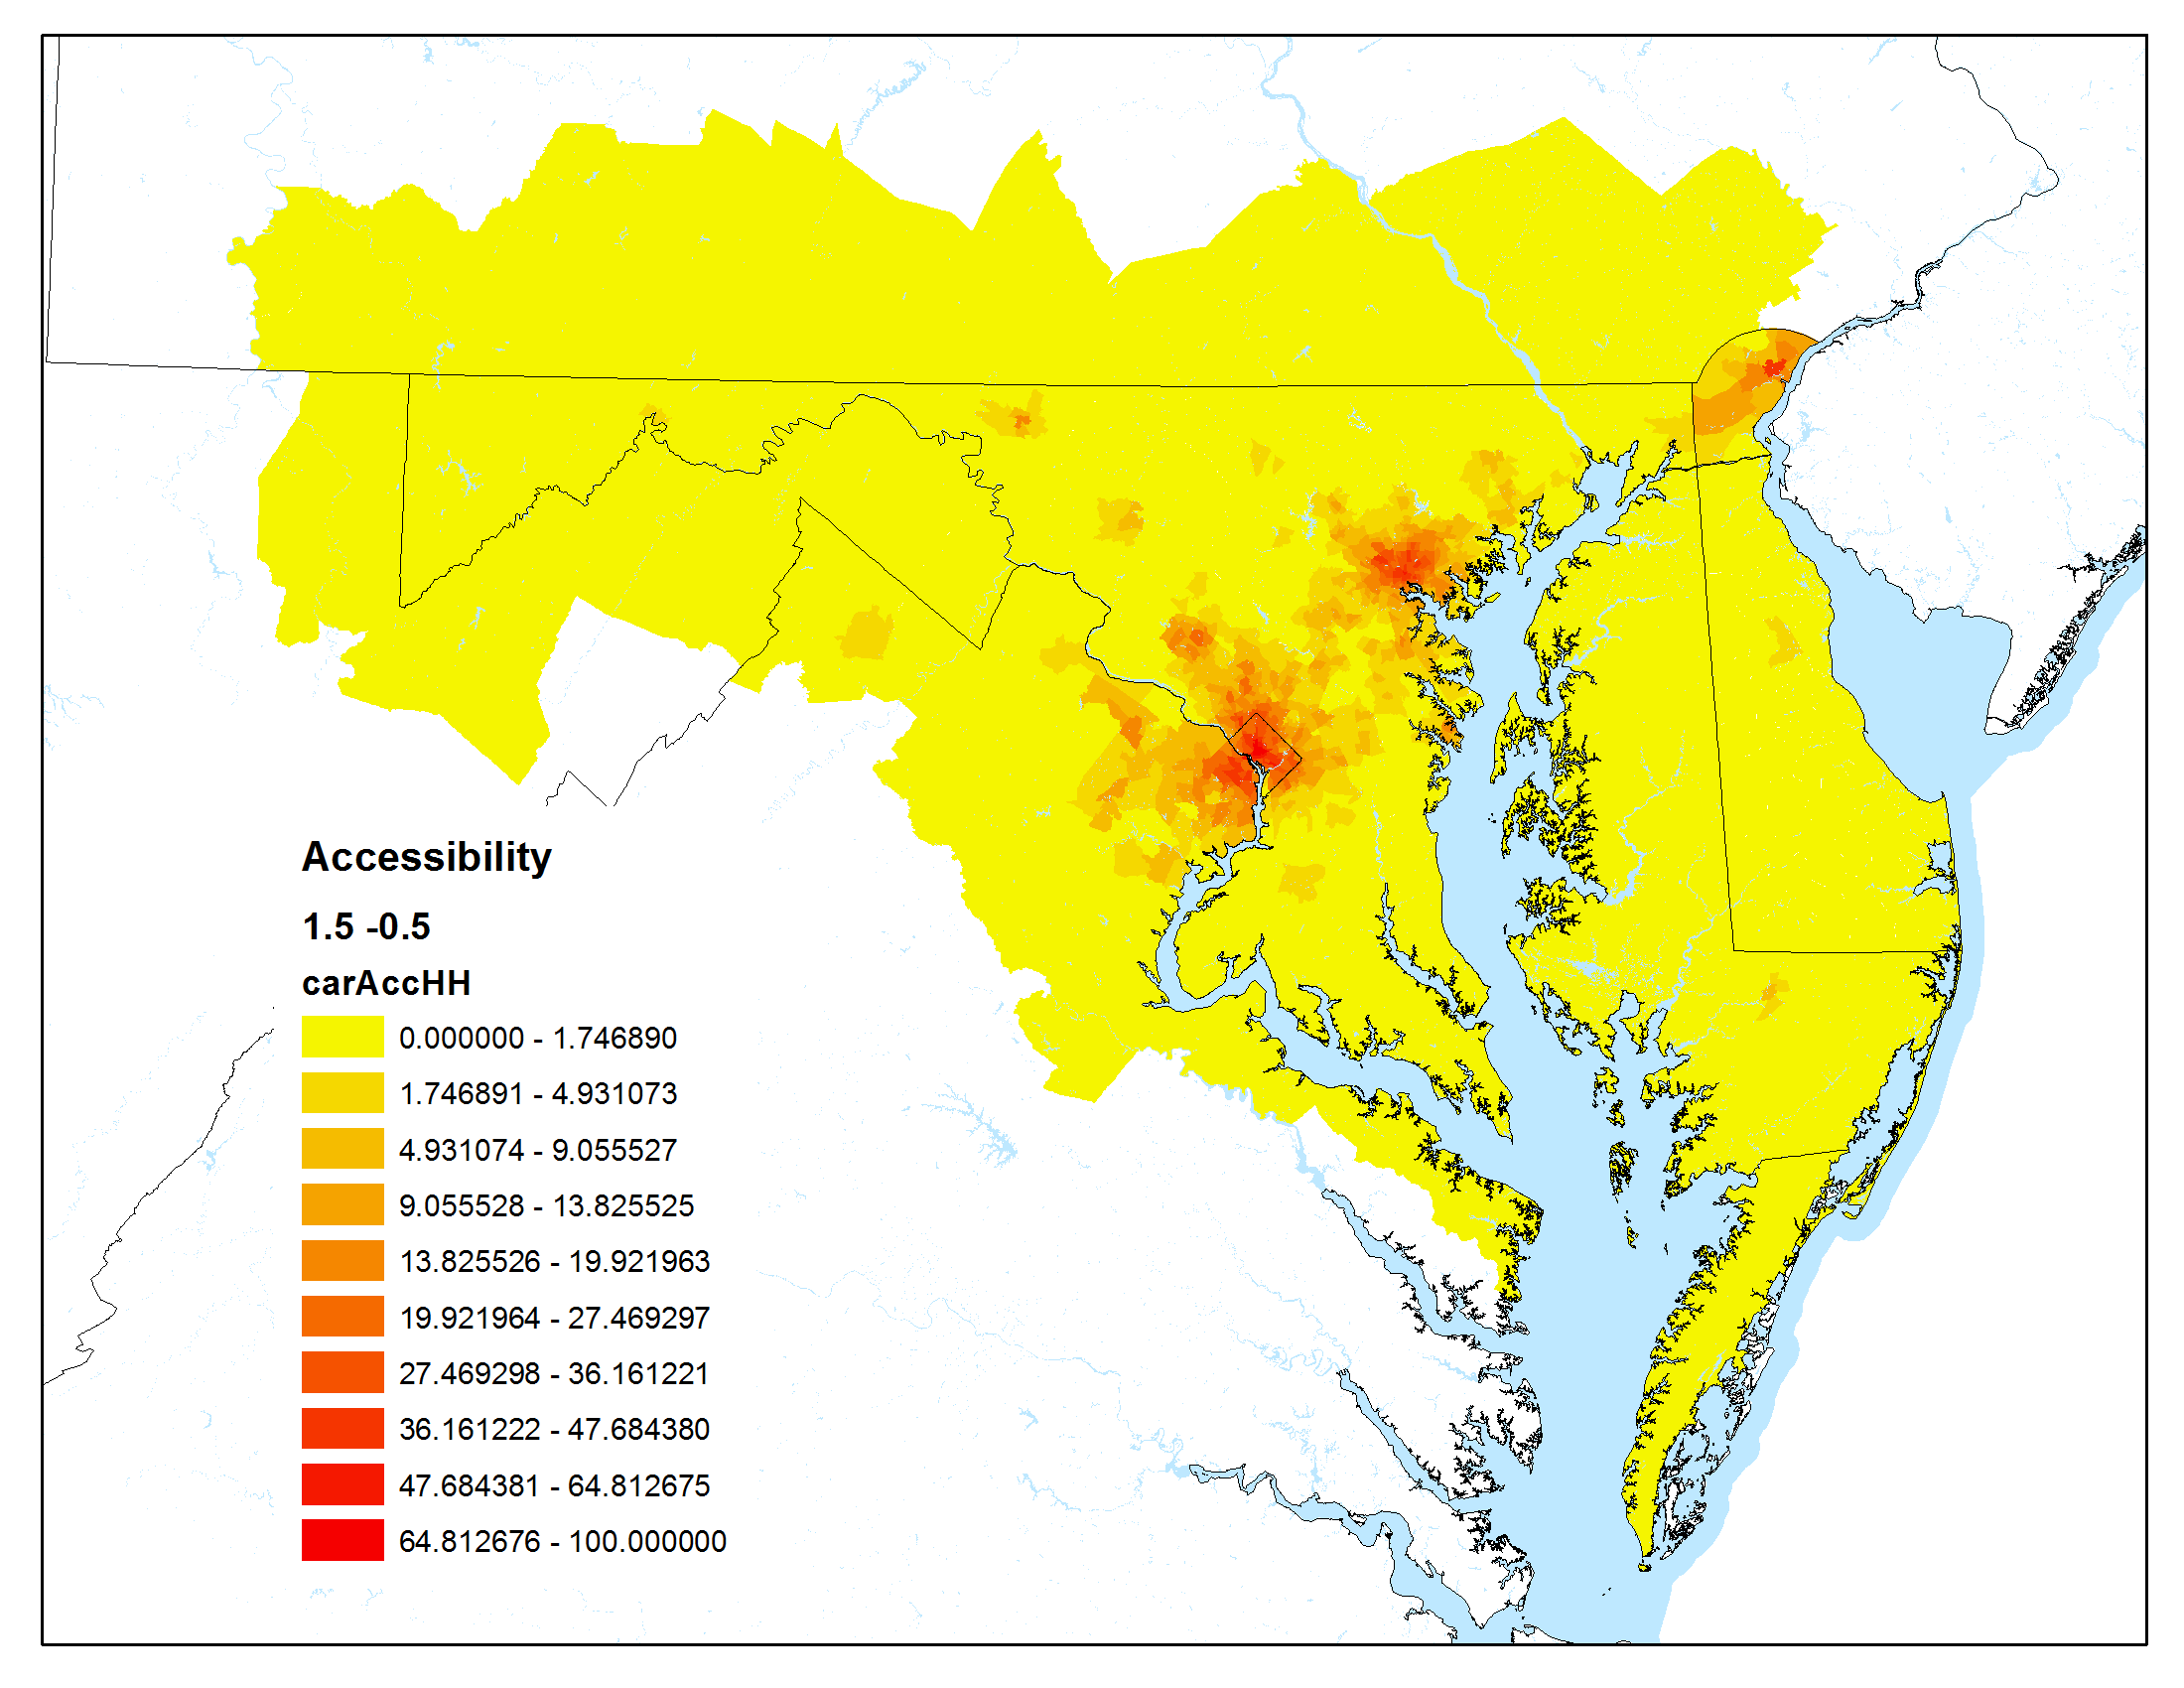
The maps below show accessibility maps that have been calculated using the Maryland Statewide Transportation Model.
For these graphics, the Hansen accessibility formula (a modified gravity formula) was used:
Auto peak travel time was used as the impedance
| Low impact of travel time, low impact of urban centers | High impact of travel time, low impact of urban centers |
|---|---|
 |  |
| Low impact of travel time, high impact of urban centers | High impact of travel time, high impact of urban centers |
|---|---|
 |  |
# References
- Dong, X., Ben-Akiva, M. E., Bowman, J. L., & Walker, J. L. (2006). Moving from trip-based to activity-based measures of accessibility. Transportation Research Part A: Policy and Practice, 40(2), 163-180.
- Geurs, K. T., & Van Wee, B. (2004). Accessibility evaluation of land-use and transport strategies: review and research directions. Journal of Transport Geography, 12(2), 127-140.
- Handy, S. L., & Niemeier, D. A. (1997). Measuring accessibility: an exploration of issues and alternatives. Environment and planning A, 29(7), 1175-1194.
- Hansen, W. G. (1959). How accessibility shapes land use. Journal of the American Institute of Planners, 25(2), 73-76.
- Wilson, Alan G. (1967). A statistical theory of spatial distribution models. Transportation Research, 1(3), 253-269.
